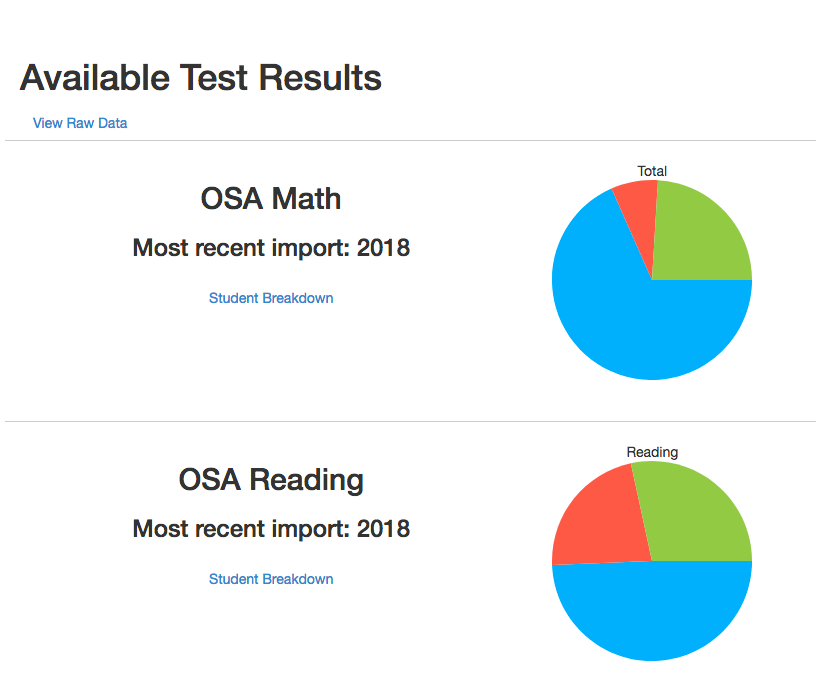
 This option initially presents a pie chart of students who do not meet, meet, and exceed on state testing. All tests are included in the single pie chart. Clicking on “View Raw Data” or “Student Breakdown” presents the following information.
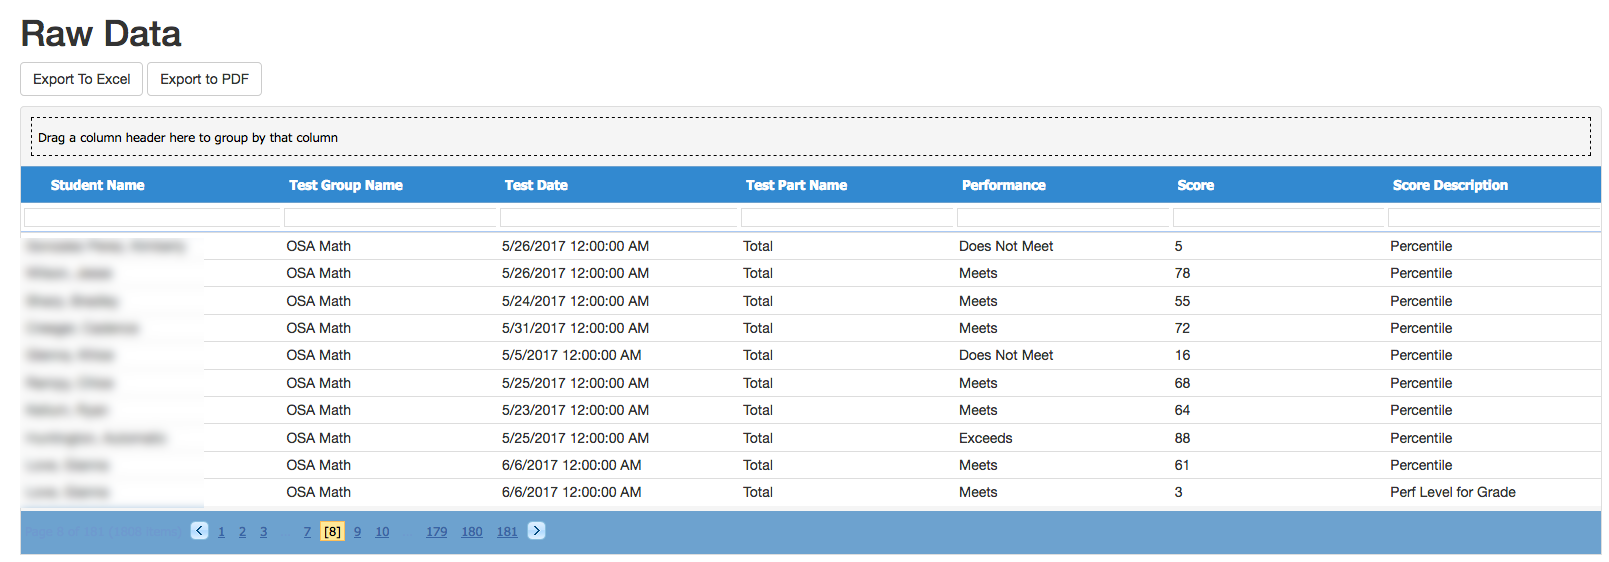
Raw Data
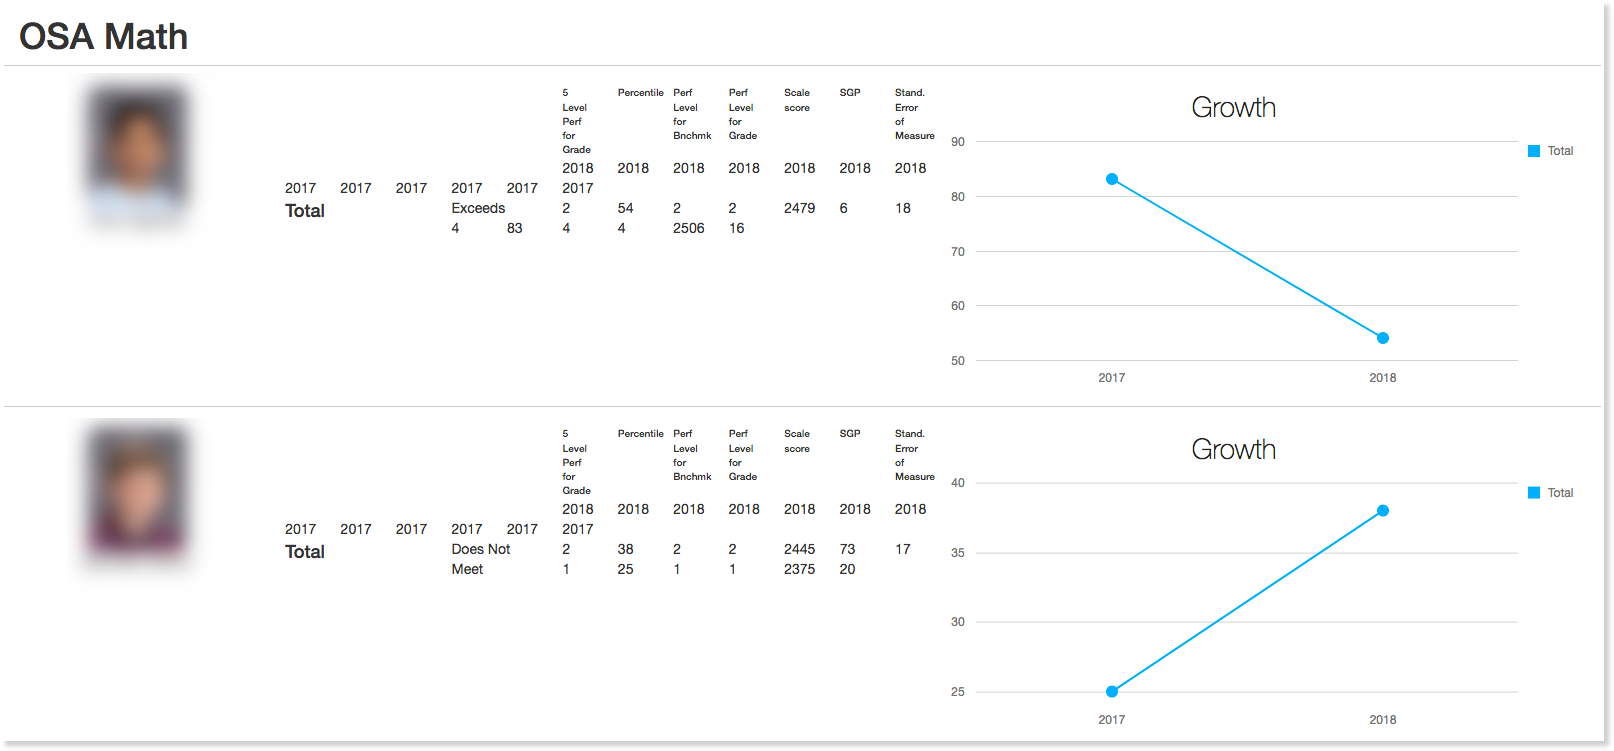
Student Breakdown